Plotting in the Terminal
This post is about the Nim library I've been developing to help with quickly plotting (mathematical) functions in the terminal. I wanted the terminal because:
- It looks cool
- It just works when ssh-ing to a remote computer
There are many alternatives, my favourite is gnuplot's dumb term. Probably the most famous stand-alone library is ASCIIChart, which I imagine there is a port of it to nearly every language you could think of, written in javascript, ported to python, Go, Java and even Nim!
So why did I do this.
There just weren't enough C O L O U R S!
This library is currently called nimtui.
Confused what \(y = x^3\) looks like? Fear not!
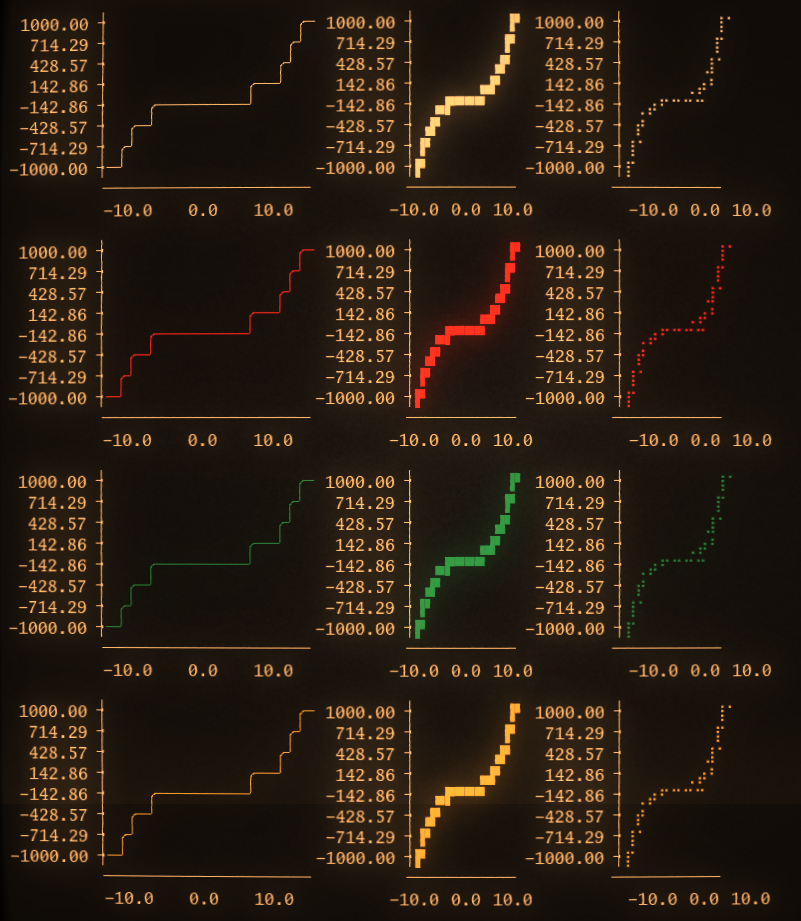
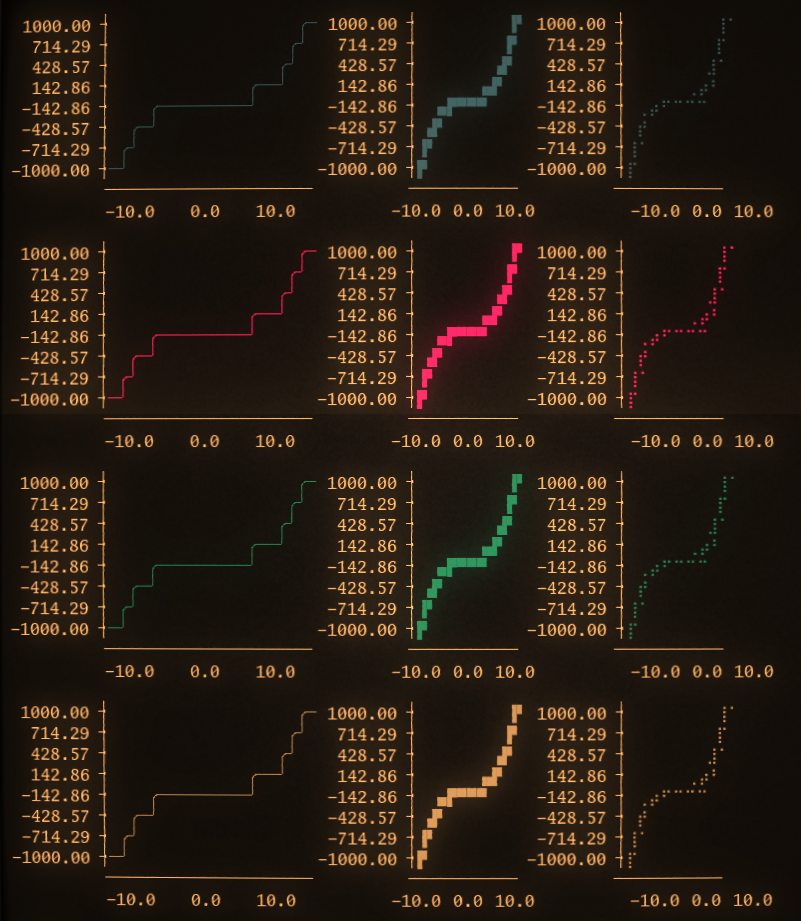
The code to gen these plots,
import sequtils
import math
import nimtui/graphs

var x: seq[float]
const maxnum = 21
for i in 0 ..< maxnum:
  x.add -(maxnum div 2).float + i.float

var y = x.mapit(it^3)

for color in TermColor:
  draw(y.plot(x= x, resolution = 8, pltCol = color),
  y.plotD(x=x,resolution = 8, pltCol = color),
  y.plotHD(x=x, resolution = 8, pltCol = color))
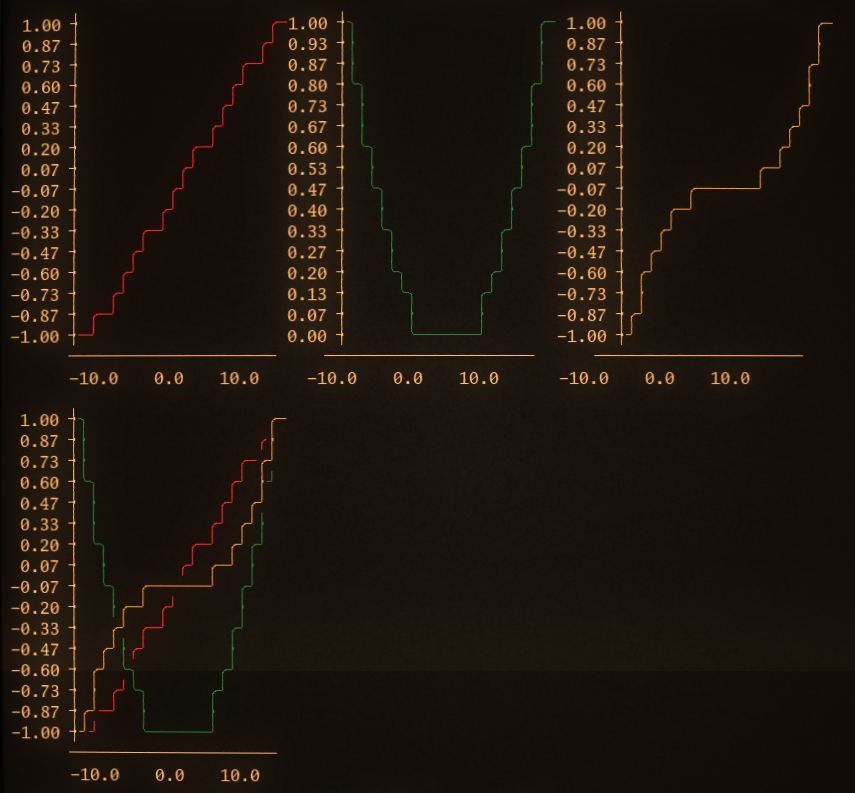
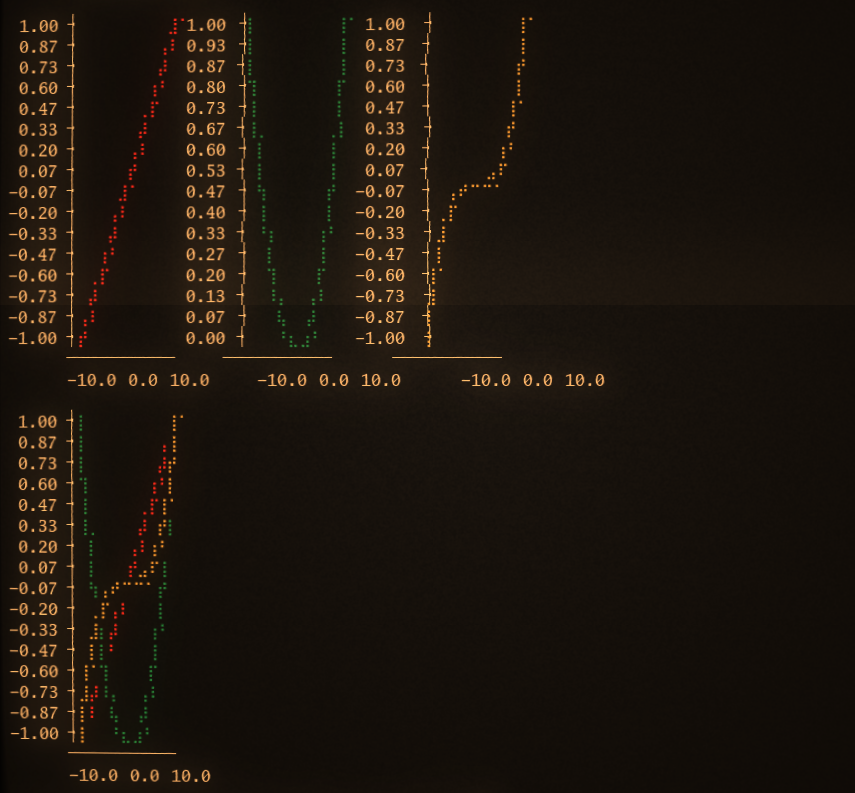
Ok that's great but what if I wanted to plot \(y = x\), \(y = x^2\) and \(y = x^3\), and I wanted a comparison of them all on a single plot. No worries!
The wiggle style
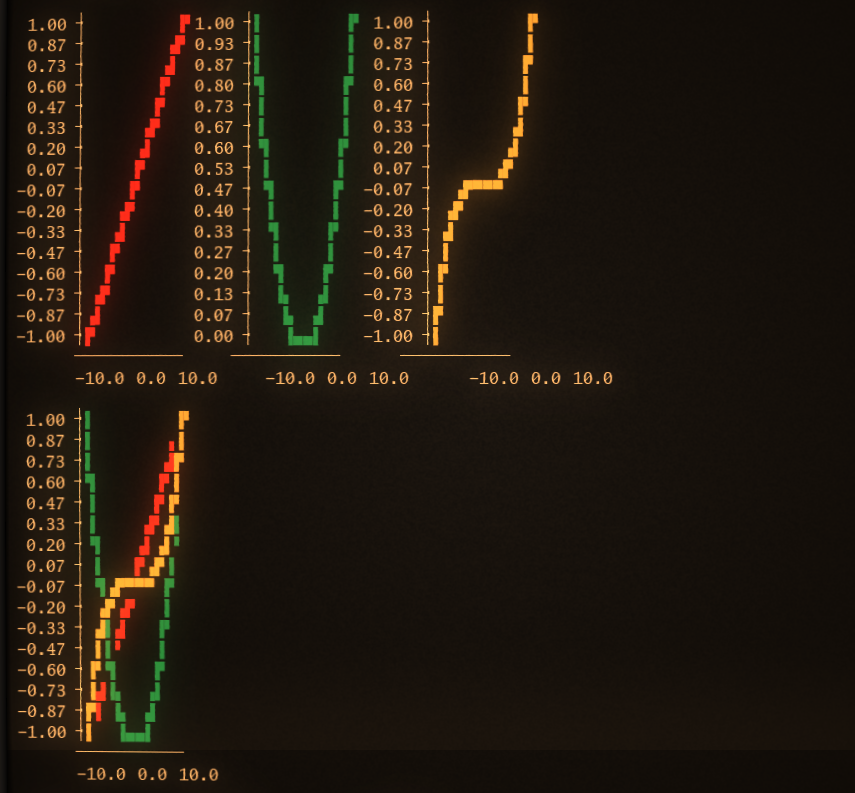
 The block style
 The Braille style
import sequtils
import math
import nimtui/graphs

var x: seq[float]
const maxnum = 21
for i in 0 ..< maxnum:
  x.add -(maxnum div 2).float + i.float

block:
  var plots: seq[Plot]
  for i in 1 .. 3:
    plots.add x.mapit((it ^ i)/10.pow(i.float)).plot(x = x, pltCol = TermColor.toSeq[i])

  draw(plots)
  multiplot(plots)

block:
  var plots: seq[Plot]
  for i in 1 .. 3:
    plots.add x.mapit((it ^ i)/10.pow(i.float)).plotD(x = x, pltCol = TermColor.toSeq[i])

  draw(plots)
  multiplot(plots)

block:
  var plots: seq[Plot]
  for i in 1 .. 3:
    plots.add x.mapit((it ^ i)/10.pow(i.float)).plotHD(x = x, pltCol = TermColor.toSeq[i])

  draw(plots)
  multiplot(plots)